What can you infer about the own price elasticity of demand/ Managerial Economics
Managerial Economics – Econ
A. Elasticity Questions
1. For the first time in two years, Big G (the cereal division of General Mills) raised cereal prices by 2 percent. If, as a result of this price increase, the volume of all cereal sold by Big G dropped by 3 percent, what can you infer about the own price elasticity of demand for Big G cereal? Can you predict whether revenues on sales of its Lucky Charms brand increased or decreased? Explain.
2. If Starbuckss marketing department estimates the income elasticity of demand for its coffee to be 1.75, how will looming fears of a recession (expected to decrease consumers incomes by 4 percent over the next year) impact the quantity of coffee Starbucks expects to sell?
3. You are a division manager at Toyota. If your marketing department estimates that the semiannual demand for the Highlander is Q = 100, 000 – 1.25P, what price should you charge in order to maximize revenues from sales of the Highlander?
4. Recently, Pacific Cellular ran a pricing trial in order to estimate the elasticity of demand for its services. The manager selected three states that were representative of its entire service area and increased prices by 5 percent to customers in those areas. One week later, the number of customers enrolled in Pacific’s cellular plans declined 4 percent in those states, while enrollments in states where prices were not increased remained flat. The manager used this information to estimate the own-price elasticity of demand and, based on her findings, immediately increased prices in all market areas by 5 percent in an attempt to boost the company’s 2007 annual revenues. One year later, the manager was perplexed because Pacific Cellular’s 2007 annual revenues were 10 percent lower than those in 2006 – the price increase apparently led to a reduction in the company’s revenues. Did the manager make an error? Explain.
5. Suppose the own price elasticity of demand for good X is -2, its income elasticity is 3, its advertising elasticity is 4, and the cross-price elasticity of demand between it and good Y is -6. Determine how much the consumption of this good will change if:
a. The price of good X increases by 5 percent.
b. The price of good Y increases by 10 percent.
c. Advertising decreases by 2 percent.
d. Income falls by 3 percent.
6. The owner of a small chain of gasoline stations in a large Midwestern town read an article in a trade publication stating that the own-price elasticity of demand for gasoline in the United States is -0.2. Because of this highly inelastic demand in the United States, he is thinking about raising prices to increase revenues and profits. Do you recommend this strategy based on the information he has obtained? Explain.
B. Price Indexes
1. In year t, prices for the two goods, x1 and x2, are p1,t = p2,t = 2, and consumption of the two goods is (x∗1, x∗2) = (5, 5). In year t + 1, the two prices are p1,t+1 = 2.2 and p2,t+1 = 2.4. Show that the CPI indicates a 15% rate of inflation between the two years. How much does this overstate the damage to the consumer if their utility function is u(x1, x2) = x1x2?
2. In year t, prices for the two goods, x1 and x2, are p1,t = p2,t = 2, and consumption of the two goods is (x∗1, x∗2) = (5, 5). In year t + 1, the two prices are p1,t+1 = 2.2 and p2,t+1 = 2.4. Show that the CPI indicates a 15% rate of inflation between the two years. How much does this overstate the damage to the consumer if their utility function is u(x1, x2) = x1 + x2?
C. Some Games
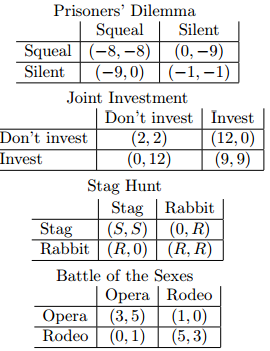
1. The following 2 × 2 games (i.e. they have two players and each player has two actions) have either 1 or 2 pure strategies equilibria. Find all of them.
2. Product differentiation and political parties. The 1929 Hotelling model of product differentiation has also been adapted to political competition for votes. Suppose that potential voters can be ranked on a one-dimensional “left-right” scale from a to b, a < b, that candidates locate themselves someplace in the interval [a, b], that voters choose the candidate closest to their most prefered point in the interval, and that voters are located everywhere in the interval. Supposing that the candidates want to be elected and that the candidate who attracts more voters is more likely to be elected. Show that the equilibrium must involve “centrism,” specifically, show that it cannot be an equilibrium (in this model) for one canditate to choose position p2 which is to the right of the position p1 chosen by the other candidate.
D. Structure of industries.
1. Based on the information given below, indicate whether the following industry is best characterized by the model of perfect competition, monopoly, monopolistic competition, or oligopoly.
a. Industry A has a four-firm concentration ratio of 0.005 percent and a Herfindahl-Hirschman index of 75. A representative firm has a Lerner index of 0.45 and a Rothschild index of 0.34.
b. Industry B has a four-firm concentration ratio of 0.0001 percent and Herfindahl-Hirschman index of 55. A representative firm has a Lerner index of 0.0034 and Rothschild index of 0.00023.
c. Industry C has a four-firm concentration ratio of 100 percent and HerfindahlHirschman index of 10,000. A representative firm has a Lerner index of 0.4 and Rothschild index of 1.0.
d. Industry D has a four-firm concentration ratio of 100 percent and HerfindahlHirschman index of 5,573. A representative firm has a Lerner index equal to 0.43 and Rothschild index of 0.76.
2. A firm has $1 million in sales, a Lerner index of 0.65, and a marginal cost of $35, and competes against 1,000 other firms in its relevant market.
a. What price does this firm charge its customers?
b. By what factor does this firm mark up its price over marginal cost?
c. Do you think this firm enjoys much market power? Explain.
3. Four different industries are dominated by the top 10 firms. Their sales are given below. For each industry, give the Gini coefficient, the four firm concentration ratio, and the Herfindahl-Hirschman index. After you have done this, compare the different methods of ranking the concentration of firms in the different industries.
a. The sales in industry A are 39, 96, 83, 45, 52, 7, 62, 82, 201, and 41.
b. The sales in industry B are 76, 2, 66, 16, 44, 66, 42, 69, 98, and 41.
c. The sales in industry C are 62, 81, 81, 97, 74, 31, 75, 76, 59, and 71.
d. The sales in industry D are 47, 94, 36, 30, 6, 66, 39, 144, 17, and 49.
E. The feedback/endogeneity critique of causal arguments.
1. Firms like Papa John’s, Domino’s, Austin Pizza, and Pizza Hut sell pizza and other products that are differentiated in nature. While numerous pizza chains exist in most locations, the differentiated nature of these firms’ products permits them to charge prices above marginal cost. Given these observations, is the pizza industry most likely a monopoly, perfectly competitive, monopolistically competitive, or an oligopoly industry? Use the causal view of structure, conduct, and performance to explain the role of differentiation in the market for pizza. Then apply the feedback critique to the role of differentiation in the industry.
2. From U.S. News and World Report, Feb. 11, 2014, we have the following. Among millennials ages 25 to 32, median annual earnings for full-time working college-degree holders are $17,500 greater than for those with high school diplomas only. That gap steadily widened for each successive generation in the latter half of the 20th century. As of 1986, the gap for late baby boomers ages 25 to 32 was just more than $14,200, and for early boomers in 1979, it was far smaller at $9,690. The gap for millennials is also more than twice as large as it was for the silent generation in 1965, when the gap for that cohort was just under $7,500 (all figures are in 2012 dollars).
By 20 years after college, the present gap in the median pay is nearly $29,000 per year. Without discounting, one finds that the median difference in lifetime earnings between high school diploma holders and college degree holders (after adjusting for the direct expense and opportunity cost of going to college) will be over $800,000. What is wrong with ascribing the difference in lifetime pay to the value of what universities teach?
3. 400 different acres of land, i = 1, 2, . . . , 400, growing corn are treated with 400 different levels of fertilizer, N1, N2, . . . , N400 (N for nitrogen, though potassium and phosphates also play a large role), and produce per acre yield, Y1, Y2, . . . , Y400. The line that best fits the 400 data points in the N -Y plane is given by Y = a^ + b^N where a^ > 0 and b^ > 0. What is wrong with using b^ as an estimate of how well fertilizer increases per acre yield? [It is worth bearing in mind that higher quality acres are more responsive to fertilizer, farmers know this, and fertilizer is expensive
