Describe the world crude oil market structure/Managerial Economics
Section A: Multiple choice
Answer all 10 questions. Each question is worth 3points. No explanation is required, no extra marks will be given and no deductions will be made for false answers.
A1. The following pair of goods/services are substitutes:
(a) Washing machines and dryers.
(b) Tennis rackets and tennis balls.
(c) Bullet train rides and flights.
(d) Beer and nachos.
A2. Price elasticity of demand for a good/service
(a) is always equal to one.
(b) is higher in the long run than in the short run.
(c) remains constant along a linear demand curve.
(d) depends on its marginal cost of production.
A3. Price elasticity of supply for basmati rice is
(a) higher in the long run because farmers cannot easily change crops once planted.
(b) low both in the short run and in the long run because rice farming requires unskilled labour.
(c) high both in the short run and in the long run because inputs required to grow basmati rice can easily be duplicated.
(d) high because consumers have a lot of other kinds of rice to choose from.
A4Ithaca has 50 restaurants only one of which employs the superb Swedish chef Olof. The other 49 chefs are paid $1,200 per week, the competitive salary. Each of these 49 restaurants makes zero economic profit out of $4,000 in weekly total revenue.Olof’s restaurant generates $5,000 per week due to his talented cooking that attracts gourmet patrons. Given that the market is competitive, Olof’s salary will be
(a) $1,200.
(b) $2,800.
(c) $3,800.
(d) $2,200.
A5A perfectly competitive firm is observed making zero economic profit. This implies that:
(a) it covers all its explicit costs exactly.
(b) its average variable cost is equal to marginal cost.
(c) its average total cost is equal to its marginal cost.
(d) its marginal revenue is equal to its average fixed cost.
A6.A single-price, profit-maximizing monopolist:
(a) maximizes marginal revenue;
(b) charges a price above its marginal cost.
(c) chooses an output level where marginal revenue begins to increase;
(d) causes excess demand by selling too small a quantity.
A7. Suppose GM is trying to outsource the manufacturing of door handles for Chevrolet sedans to a small firm. The task necessitates, from the small firm Disunited Technologies (DT), the purchase of an expensive and highly specialized machine tool that cannot be used for other purposes without prohibitively expensive retooling.
(a) DT will sign a short-term contract as the machine is very versatile to do other work.
(b) DT will only sign a long-term contract as the investment cost can only then be recouped.
(c) DT will not sign a short-term contract for fear of hold-up by GM, which means a contract non-renewal will cost DT the funds invested in the machine.
(d) some of the above.
A8. An example of positive externalities generated by a good/service coupled with an under-provision by the market is:
(a) smoking;
(b) beekeeping next to an apple orchard;
(c) noisy late-night partying in an apartment building;
(d) driving in dense urban areas.
A9. Pollution taxes and/or tradable permits are more efficient means than quotas (or quantitative controls or across-the-board cuts) to reduce pollution because
(a) imposing across-the-board-cuts is effective.
(b) pollution taxes impose similar cuts to all polluting firms.
(c) tradable pollution permits are allocated freely to polluting firms.
(d) both pollution taxes and tradable permits equalize marginal pollution-reduction (abatement) costs across polluting firms.
A10. Both the price and the quantity of oranges will increase if:
(a) a Johns Hopkins medical study finds that oranges contain hitherto unknown anti-carcinogenic compounds.
(b) the prices of clementines and grapefruits fall drastically.
(c) there are frosts in Florida and California.
(d) this year’s orange crops in Florida and California are exceptionally good.
Section B: Essay questions
Please answer 2of the following 4 questions. Each question is worth 20 marks.
B1.
U.S. goods and services trade with China totaled an estimated $659.4 billion in 2015. Exports were $161.6 billion; imports were $497.8 billion. The U.S. goods and services trade deficit with China was $336.2 billion in 2015. The top import category from China is electronic equipment at $135.9 billion per year. (These figures only serve to contextualize the problem.)
One particular good in this category is personal computers (desktops/laptops), which we will consider to be Lenovo. The U.S. domestic market demand and supply curves for personal computers (PCs) are given, respectively, as QD = 20 – P and QS = – 4 + 2P where Q is given in millions whereas P in 100s.
(a) Find the domestic market equilibrium and the own-price elasticity of demand and the supply elasticity at this equilibrium.
(b) Suppose, now, that the U.S. economy is open and the world supply curve is horizontal at P = $4, i.e. Lenovo can supply any quantity of PCs at price equal to $4. Find the domestic quantities supplied of PCs and demanded for PCs at this free-trade equilibrium, and the quantity of imports.
(c) Suppose the incoming administration imposes a tariff of $2. Find the domestic quantities supplied of PCs and demanded for PCs at this free-trade equilibrium, and the quantity of imports.
(d) Draw a simple diagram to illustrate parts (b) and (c). Indicate the winners and losers from this tariff. Express, in terms of areas,their wins and losses. Indicate and explain the deadweight loss (DWL).
B2. A monopolist, with a cost function C(Q) = 60 + 2Q, faces two market slices given by the inverse demand functions P(Q) = 16 – Q(the large market L) and P(Q) = 12 -Q.
(a) If this monopolist implemented first degree price discrimination in these two segmented markets(with no arbitrage possible and selling to each consumer at the maximum they are willing to pay), compute its profit.
(b) If it can implement third degree price discrimination, i.e. it can segment the markets but charges a single price in each market, compute the prices PL and PS, and quantitiesQL and QS in the two markets. Compute the monopolist’s profit.
(c) Calculate the price elasticities (EL and ES) in the two markets at the prices found in part (b). What is the relationship between prices and elasticities between the two markets?
(d) Suppose the monopolist does not price discriminate but, crumbling under pressure by protesters, charges a single price by adding quantities demanded in the two markets to obtain the aggregate demand function and then chooses the profit-maximizing single price P and selling the respective quantities QL and QS. Compute its profit.
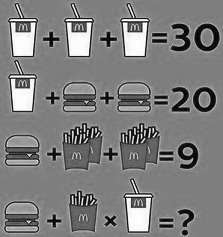
B3. Last April 1st, a McDonald’s outlet is rumored to have posted the following prices.
Courtesy of Luis Lugo Platt (EMBAA 2018, Cornell).
Remark: You may ignore the costs throughout.
(a) Compute the three individual item prices from the figureabove.
(b) A local market research report yielded information on the three types (A, B, C) of consumers’ willingness to pay for each item as detailed in the table below. What single prices should McDonalds charge?Compute its profit.
(c) What price would you suggest for the combo (all three bundled) indicated if no sides are available separately? Compute its profit.
(d) What are the profit-maximizing combinations and their prices if McDonalds can offer a combo (all three bundled) as well as choosing whether or not to offer any of the three components separately? Compute its profit.
|
A |
B |
C |
|
| Fries |
5 |
2 |
1 |
| Coke |
10 |
10 |
2 |
| BigMac |
4 |
5 |
7 |
B4. Two firms, Sleek Oil (SO) and North Lumber (NL), +have access to five production processes with different emissions consequences as given below.
| Process
(emissions) |
A (4 tons per day) |
B (3 tons per day) |
C (2 tons per day) |
D (1 ton per day) |
E (0 ton per day) |
| Sleek Oil cost
($/day) |
100 |
140 |
240 |
400 |
1,000 |
| NorthLumber cost
($/day) |
200 |
360 |
1,000 |
2,000 |
4,000 |
(a) If emissions are unregulated, which process will each firm use and what will be the total quantity of emissions per day?
(b) The City Council decides to halve emissions by quantity controls, which it can implement. What will be the total cost to society of halving emissions by quantity controls?
(c) The City Council decides to halve emissions by imposing an emissions tax of $T per ton emitted, which it can implement. What will be the tax $T per ton imposed andthe total cost to society of halving emissions by this pollution tax?
(d) The City Council decides to halve emissions by pollution permits, which it can implement. What will be the market price of a permit andthe total cost to society of halving emissions by implementing a market for pollution permits?
Section C: Analysis of a business press article
OPEC deal and shale cowboys
Information
A. Crude oil prices traditionally increase when OPEC production targets are reduced. OPEC countries currently produce about 40 percent of the world’s crude oil. However, equally importantly, OPEC’s oil exports reach toabout 60 percent of oil traded internationally.
B. The recent technological breakthroughs gave rise to thousands of shale oil (and gas) cowboys in the U.S. (See U.S. Energy Information Administration data below, http://www.eia.gov/todayinenergy/detail.php?id=28652.) This fringe of small producers seem capable of producing unlimited quantities once profitable as well as the fringe being open to entry.
C. You may also want to look at “American Shale Companies’ Rush to Hedge Is Turning the Oil Market Upside Down”, by Javier Blas, Alex Longley, and Alex Nussbaum, December 5, 2016
https://www.bloomberg.com/news/articles/2016-12-05/oil-market-turns-upside-down-as-shale-rushes-to-hedge-post-opec
for a similar article to the one below.
Article to be analyzed
Oil prices
OPEC reaches a deal to cut production or Viennese waltz
Oil prices surge as Saudi Arabia and Iran sign on to a deal at OPEC’s meeting in Vienna
Dec 3rd 2016 | VIENNA
http://www.economist.com/news/finance-and-economics/21711088-oil-prices-surge-saudi-arabia-and-iran-sign-deal-opecs-meeting
EXACTLY two years after Saudi Arabia coaxed its fellow OPEC members into letting market forces set the oil price, it has performed a nifty half-pirouette. On November 30th it led members of the oil producers’ cartel in a pledge to remove 1.2m barrels a day (b/d) from global oil production, if non-OPEC countries such as Russia chip in with a further 600,000 b/d. That would amount to almost 2% of global production, far more than markets expected. It showed that OPEC is not dead yet.
The size of the proposed cut, the first since 2008, caused a surge in Brent oil prices to above $50 a barrel. Some speculators think it may mark the beginning of the end of a two-year glut in the world’s oil markets, during which prices have fallen by half and producers such as Venezuela have come close to collapse. As long as prices continue to recover, Saudi Arabia can probably shrug off the fact that its previous strategy damaged OPEC at least as badly as non-members, and that this week’s deal gave more breathing space to its arch-rival Iran than it would have liked.
The rally’s continuation, however, depends on non-OPEC members such as Russia reliably committing to cut output at a meeting on December 9th. It also hinges on the speed at which American shale producers step up production, and on Donald Trump’s dream of oil self-reliance.
Since the end of September, when OPEC sketched out a deal in Algiers to cut production, Saudi Arabia’s oil minister, Khalid al-Falih, and his Iranian counterpart, Bijan Zanganeh, had engaged in a game of brinkmanship that at times seemed likely to doom this meeting. Oil prices have staged frenetic swings since then (see chart). Days before the Vienna gathering, some analysts gave it a mere 30% chance of success. The betting was that failure would push prices well below $40 a barrel, and possibly bring about the collapse of OPEC.
But Saudi Arabia, OPEC’s biggest producer, realised that pragmatism was its best option. Its promised 4.6% cut in production is mirrored by many other OPEC members, though Iran was permitted a token increase as it recovers from nuclear-related sanctions. That may be galling for Saudi Arabia, but it is likely to benefit far more than Iran from the rise in oil prices, if sustained, than it will lose from lopping 486,000 b/d off its total output. It promises to cut to 10.05m b/d, which is not far below its level in the first quarter of 2016.
Moreover, the government’s plans to modernise the economy and partly privatise Saudi Aramco, the state oil company, depend to some extent on higher oil prices, says Bhushan Bahree of IHS Markit, a consultancy. Counter-intuitively, he says that the kingdom needs higher oil revenues as “a bridge” to becoming a less oil-dependent economy. OPEC argues that a modest cut now will spur investment in new sources of crude that will prevent harmful oil shortages in the future.
The cuts take effect from January 1st and will last for six months. During that time, traders will monitor oil-tanker traffic to ascertain whether fewer are leaving port. They cannot monitor Russia’s pledge to cut 300,000 b/d of production, because much of its production moves by pipeline, says Abhishek Deshpande of Natixis, a bank. But he believes that even so the agreement will start to cut global oil inventories next year. Non-OPEC output has fallen this year, adding impetus to the cartel’s efforts.
Some speculators were bullish even before the deal. Pierre Andurand of Andurand Capital, a hedge fund, says the OPEC agreement could push oil above $60 a barrel within weeks. He notes that speculators were mostly betting on an OPEC failure, and that big oil consumers may need swiftly to protect themselves against rising prices. Airlines, for example, could scramble to hedge against soaring fuel costs.
If oil prices continue to rise, American shale producers will ramp up output, in effect capping the oil price. This may not happen as swiftly as some think. After all, there are suspicions that, to coax Wall Street investment, shale producers have exaggerated their ability to produce low-cost oil. But many of them are still standing, despite OPEC’s best efforts to kill them off. The cartel cannot declare even Pyrrhic victory from the past two years.
This article appeared in the Finance and economics section of The Economist’s print edition under the headline “Viennese waltz”
Questions
(a) Describe the world crude oil market structure in terms of market forms covered in the course.
(b) Illustrate the world supply curve in the light of the above information (plus Slide 39 Session 1) and knowing that the countless U.S. shale oil wells become profitable over the interval $50-$60.
(c) Does the supply curve you depicted/described in part (b) resemble Slide 39? What does the information given in part (b) add to it?
(d) Considering the time frames short-run and long-run, can one assert that the world crude oil price is capped at $50-$60?
(e) Adding the world demand for oil into the picture, i.e. essentially the effects of alternative fuels and of the economies of China and India since 2014, depict/describe the world market for crude oil in the past three years.
(f) Provide a prediction into the near future making explicit your assumptions and integrating them to your supply and demand curves.
Remark: The price fell drastically in 2014 and it is yet to recover, if at all.
