Estimate the impact campus crime/ Econometrics
1. You collect data on crime and new student enrollment from 97 randomly selected colleges across the United States for the year 2010. You then run the following series of models (note that the dependent variable of each regression is listed at the top of each column):
Table 1
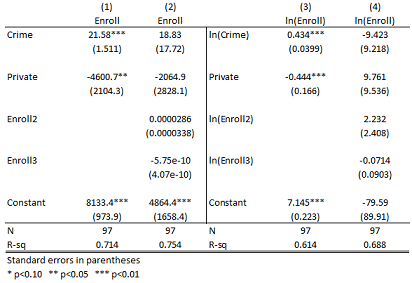
Where:
Enroll = total new student enrollment in 2010 for a college
Crime = the total number of crimes reported on a campus in 2010
Private = 1 if the school is a private school and 0 if it is public
Enroll 2 = Squared predicted values of Enrollfrom Model 1
Enroll 3 = Cubic predicted values of Enrollfrom Model 1
ln(Enroll) = log of Enrollment
ln(Crime) = log of Crime
ln(Enroll2) = Squared predicted values of ln(Enroll) from Model 3
ln(Enroll 3) = Cubic predicted values of ln(Enroll) from Model 3
A. Using the information in Table 1, would you prefer to use Model 1 or Model 3 to estimate the impact campus crime has on new student enrollment? What evidence is there to support your answer?
B. Why might Crime in Model 1 and ln(Crime) in Model 3 each have a positive sign? Does more crime attract more students to a particular college?
C. You next run the following models as shown in Table 2.
Table 2
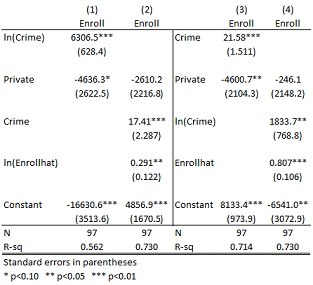
Where:
Enroll = total new student enrollment in 2010 for a college
Crime = the total number of crimes reported on a campus in 2010
ln(Crime) = log of Crime
Private = 1 if the school is a private school and 0 if it is public
ln(Enrollhat) = Predicted values of Enroll from Model 1
Enrollhat = Predicted values of Enroll from Model 3
Using the information in Table 2, would you prefer to use Crime or ln(Crime) as an independent variable when Enroll is the dependent variable? What evidence is there to support your answer?
2. You collect unadjusted, quarterly data on nominal wages, unemployment, and prices in the United States from 1940 through 2011 from the United States Bureau of Labor and Statistics. Wages are the median wage in the United States in each quarter, the unemployment rate is reported for each quarter, and price is an index based on the Consumer Price Index in each quarter.
A. Can we use the data as is to run a reliable regression of the unemployment rate on wages? Why or why not, and is there any way we could transform the data into something more reliable?
B. You next decide to further examine the relationship between wages and prices over this time period. You run a regression of ln (wage) on price and lagged price and obtain the following results (standard errors in parentheses):
ln(wage)it = 0.576 + 0.041*priceit – 0.0224*priceit-1 + 0.016*priceit-2 – 0.029*priceit-3 + µit
(0.013) (0.01) (0.008) (0.019) (0.01)
N = 284, R2 = 0.958
What is the temporary and permanent impact of an increase in prices on wages based on these results? How would we test if the permanent impact of a price change is statistically significant?
C. Can we say that this model has a strong goodness-of-fit using the information from part B? Why or why not?
D. Do you believe that prices and wages in your model are covariance stationary? Why or why not, and how could you adjust your model accordingly?
E. You now decide to run another model with the goal of examining how wages have fluctuated during this period.
wageit = β*wageit-1 + µit
How would you characterize this model given what we have learned about time series?
F. You run the model from Part E and obtain the following results:
wageit = 1.004*wageit-1 + µit
(0.0003)
Based on these results, what can we say about the relationship between wages this quarter and wages last quarter? Does this affect any of our time series assumptions, and is there an alternative way we could specify our model to accommodate this relationship?
3. In an effort to improve on-campus sales, Chicken Lou’s asks you to help them conduct a survey of Northeastern University students. For each student you survey, you ask for information about their sex, race, whether or not they are a first-year student, and how many times they have eaten at Chicken Lou’s in the past 6 months. You spend a week handing out surveys to students on the corner of Huntington Avenue and Forsyth (right near Chicken Lou’s).
A. At the end of the week, you begin analyzing the data and notice that age, race, and sex each have some missing entries. Under what conditions would this pose and not pose a problem for your estimation?
B. Suppose you plan to use the data to run a regression where how many times a student has eaten at Chicken’s Lou’s in the past 6 monthsis the dependent variable:
CLoui = β0 + β1*firstyeari + β2*sexi + β3*blacki + µ
Where:
CLou = the number of times student i ate at Chicken Lou’s in the past six months
firstyear = 1 if student i is a first-year student and 0 otherwise
sex = 1 if student i is female and 0 if male
black = 1 if student i is black and 0 otherwise
Will you be able to obtain reliable estimates with CLou as the dependent variable? Why or why not?
C. Now suppose you plan to run another regression examining the probability that a student is a first-year student based on their tendency to eat at Chicken Lou’s (variable definitions are the same as part B).
firstyeari = β0 + β1*CLoui + β2*sexi + β3*blacki + µ
Will you be able to obtain reliable estimates with CLou as an independent variable? Why or why not?
Textbook regarding these questions: Wooldridge, Jeffery M., Introductory Econometrics: A Modern Approach, 4th Edition, 2009.ISBN-10: 0324581629 ISBN-13: 9780324581621.
The questions are almost from the last three chapter
