Fit possible statistical cost functions to the data
Managerial Economics
Submit a file that has all the answers for the questions and an Excel file that has only the data and regression outputs. For the Excel file, make sure you give the name for each spread sheet such as data, straight- line, quadratic and cubic. Do not forget to put the group number and the names of the participants on the project in the Word document.
The project below is Question 9 on page 287, chapter 7. I deleted certain questions. Make sure you read pp. 258-260 with the special attention to Figure (the three different specifications of the total cost function) and pp. 295-305 from your textbook.
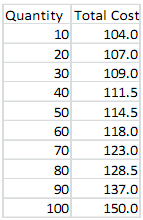
You have been presented with the following cost data and asked to fit a statistical cost function:
1. Fit three possible statistical cost functions to the data. Use straight- line, quadratic, and cubic formulas.
2. Discuss the statistical results you obtained in question 1. Include in your discussion R2, the coefficients, and the statistical significance of the coefficients. For the statistical significance test, use the p-test rather than the t-test. If you decide to use the t-test, you first have to find the degrees of freedom and then find the appropriate critical t-value in Table A.4 on page 583.
3. If the data represent 10 months of production for one plant of a specific company, would you consider this to be a short-run analysis?
4. How would your answer to question 3 change if you were told that the data represent 10 different plants during a particular month of the year?
Textbook required – Paul G. Keat and Philip K.Y. Young, Managerial Economics,7th ed., Pearson Prentice Hall
